
Trump’s upset victory over Clinton last year surprised just about everyone. Particularly since he lost the popular vote by nearly 3 million ballots, I wanted to see how that election compared to other recent ones to better understand how much of an outlier Trump’s victory was. To more fairly compare election results across their different electorates, I wanted to normalize the vote share won by each party, and I chose to do it by dividing votes cast into the number of registered voters for each state [1]. The Census Bureau aggregates that registration data for each federal election, but the result for a given election isn’t certified and published until well into the following year.
I experimented with several regression techniques on the historical registration figures to approximate the 2016 result and ultimately settled on a simple linear regression for the analysis. In May of this year, the Census Bureau released the official registration data and I’ve now been able to calculate the actual vote share. It appears that the regression approach was a relatively accurate predictor, which further corroborates my earlier claim that a widespread “enthusiasm gap” primarily hurt Democrats in 2016.
estimation accuracy
First let’s review the quality of the regression estimation. Nearly a quarter of states (12) had actual registration rates within a single percent of the estimated registration; exactly three fifths (and the District of Columbia) were within two percent. Only six states were off by four percent or more and it’s worth discussing them in detail [2]:
- New Mexico registered just 93.64% of what was estimated, likely due in part to a sharp drop in population growth there. The Census Bureau estimates that that state’s overall population, just north of 2 million, grew by more than 20,000 between 2010 and 2013. But by 2016 it was down 4,000 from the 2013 peak.
- Hawaii was also markedly down at 94.51%; but that solidly blue state’s native son was no longer on the ballot and Clinton ran a fairly negative primary campaign against him in 2008.
- North Carolina was at 94.94%. That state was solidly purple with neither party winning a majority. Trump won by fewer than 4% of votes cast, a margin tighter than the shortfall of the actual registration from my prediction. And both major parties won a higher share of registered voters in North Carolina than any of their own past nominees this century — in most cases sharply so — except for Trump as compared with Bush 2004 and Clinton as compared with Obama 2008.
- South Dakota was the last state substantially overestimated, actually registering at 95.62% of what was predicted. The Census Bureau estimates that overall population growth has slackened by about a third in comparing the first three years of this decade to the second three. The state has fewer than one million residents.
- North Dakota, on the other hand, significantly outperformed by registering 104.54% of the estimate. Democratic share was down as compared with every previous nominee this century — and quite sharply down from the Obama years — while Republican share was improved over each earlier nominee. The Census Bureau estimates that North Dakota added to its roughly three-quarter million population between 10 and 20 thousand — or about 1 to 3% — each year between 2010 and 2015. But it added just one thousand in 2016. Most likely many of the workers involved with North Dakota’s oil boom and subsequent bust turned out for Trump.
- Utah also greatly exceeded expectation by registering 106.34% of the estimate. As noted last year, the Beehive State also stood way out by rallying to support a Mormon third party candidate only on the ballot in eleven states [3]. Aside from Obama’s 2008 landslide, Clinton did about as well as or slightly better in Utah than any other Democrat this century. Since Trump still comfortably carried the state in that three-way race, it’s clear that there were many first-time Utah voters in 2016.
registration shortfall
Since the majority of the few significant outliers — all six still within 7% error — have some interesting proximate circumstances to explain them, I conclude that this estimation technique was fairly accurate. Rolling up the whole of the United States puts the overall registration rate at just a slight shortfall of my estimate there: 99.01%. But more than three quarters of the States, 38 in all, also fell short of their estimated registration rates; the average of the statewide rates is lower than the national rollup, at 98.92%; and the median rate was lower still, at 98.67%. At the same time, the Census Bureau estimates that the overall population of the United States grew steadily by between 2.2 and 2.4 million each year since 2010. Perhaps widespread voter suppression hit two thirds of the states, but more likely there was a broad “enthusiasm gap” [4].
In a few cases that gap was particularly significant. As already mentioned, Trump’s margin of victory in North Carolina was tighter than the estimation shortfall. Several other electoral-vote-rich states also fell into that category: Michigan, Florida, Pennsylvania, and Wisconsin. Those are four of the only six states that flipped from Obama’s winning coalition in 2012, and three of them were the focus of Jill Stein’s recount push and most of the monday morning quarterbacking of Clinton’s campaign. It was already clear that low turnout in those states was decisive in Clinton’s loss there, but to that we may add that if registration had merely stayed on track from historical trends it could have been enough to prevent it [5].
aggregate turnout and share swings
Now armed with the official registration numbers (as well nearly a million late-breaking votes, virtually all from deep-blue New York and California, published in the weeks following my original post), it is possible to assess the accuracy of the overall analysis from last December. I take each major claim from my earlier post in turn, presenting the actual numbers and highlighting key differences from the estimation.
| Year | Democrat | Republican | Third Party | Total |
| 2012 | -1.4% | -0.01% | +3.23% | +1.82% |
| 2008 | -6.03% | -1.18% | +3.41% | -3.8% |
| 2004 | -0.22% | -4.12% | +4.06% | -0.32% |
| 2000 | +1.97% | +0.6% | +1.85% | +4.42% |
Nationwide average share was as much as 1% better than estimated for every party as compared with other 21st century elections. A few significant data points flipped. The December estimate had everyone doing better over their 2000 election counterparts except Trump; but the actual result puts Trump in that camp too. Trump also did about as well as Romney in 2012 (not 0.75% worse). Perhaps most interesting: overall turnout share was actually up nearly 2% from 2012, rather than essentially tying with it as estimated. That’s what we’d expect in a contested election, but in 2016 that extra average share benefited only third parties.
| Year | Democrat | Republican | Third Party | Total |
| 2012 | -2.69% | +0.35% | +4.28% | +1.94% |
| 2008 | -7.26% | -0.25% | +4.51% | -3.01% |
| 2004 | -1.45% | -3.42% | +4.99% | +0.1% |
| 2000 | +0.91% | +0.85% | +2.37% | +4.12% |
Averaging intrastate share differences across the states also yields some interesting shifts. Clinton and Trump were estimated to have about a quarter percent less average share, state-by-state, than their 2000 election counterparts; but in fact they each did just under a percent better. Clinton outperformed Trump slightly in that adjustment, and it’s mainly due to the net extra quarter million votes certified to her in New York and California after the December estimate was made. Trump’s actual share was much closer to tying McCain’s from 2008 and he actually bested Romney’s average share from 2012. Really, all three recent Republican candidates did about as well as each other by this measure while Clinton performed drastically worse than Obama both times he ran.
particular intrastate vote share claims
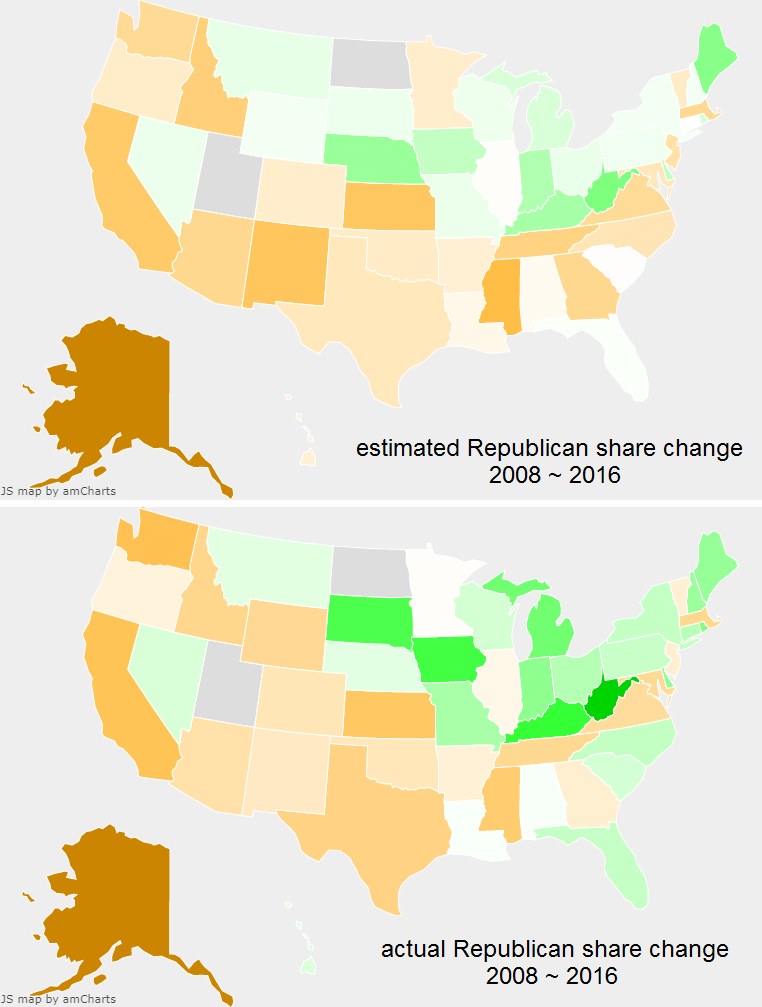
The heat map that aided in the initial analysis is now updated with “2016 (estimated)” and “2016 (official)” data series. Voter share was of course broadly up across most states as compared with the initial analysis since registration was broadly down, particularly in the South. Overall turnout share adjustments stayed within ±8% for the 44 states not called out earlier as swinging dramatically away from the regression estimate. It’s worth revisiting the specific claims of the estimation to update and at times correct it with the official data, but also to note where the estimation was more or less correct. Once again, green is a positive share change and orange is negative one in all the heat maps.
Third party share was the least affected by the revised totals since they won such a small portion of votes cast overall. The broad trend is sustained in comparing third party voting in 2000, the last time the electoral college disagreed with the popular vote and charges of throwing the election were raised. Only Alaska and Connecticut turned out above 1% less for third parties last year than in 2000; Montana and New York were down less than half a percent; and all other states’ registered citizens voted as much or more for third parties as was estimated. The maps are so close, even ignoring Utah, that I’ve omitted them here (but again, you can play with the results yourself here).
Comparing Republican share between 2008 and 2016 is largely unchanged. The surprise registration in North Dakota and Utah made Republican performance there drop more than 9 points from the estimate, dramatically softening Trump’s rout in the former and further emphasizing his party’s dramatic abandonment in the latter. At the same time, South Dakota and West Virginia — being in the top five of states with depressed registration as compared with the regression estimate — added 5 points to his wins in each. The correction was also enough to flip both Carolinas and Hawaii from losses to wins for Trump relative to McCain. Otherwise the picture was largely unchanged except that Trump’s decisive gains in the midwest are a lot more pronounced.
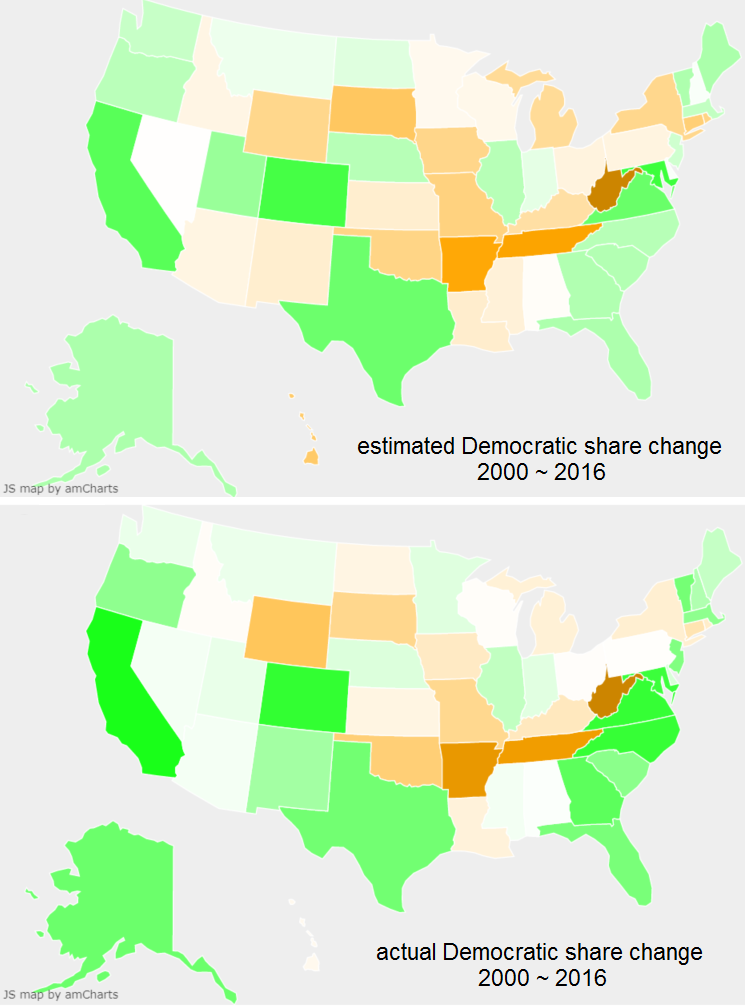
Nothing too significant has changed in comparing Clinton 2016 to Gore 2000. Clinton ultimately did slightly better in much of the South than predicted, in particular flipping both Alabama and Mississippi from narrow losses to even narrower wins as compared with Gore’s share there. She similarly flipped the western states of Arizona, Nevada, and the massively under-registered New Mexico. She lost North Dakota, won Minnesota, and nearly tied in Hawaii. Perhaps the best news for Clinton is that she lost only 2% (rather than 5%) of Gore’s share in New York thanks to those late-breaking votes. Otherwise little was changed with the official numbers in hand, including Clinton still losing by more than 10% as compared with Gore in Tennessee, West Virginia, and her home state of Arkansas.
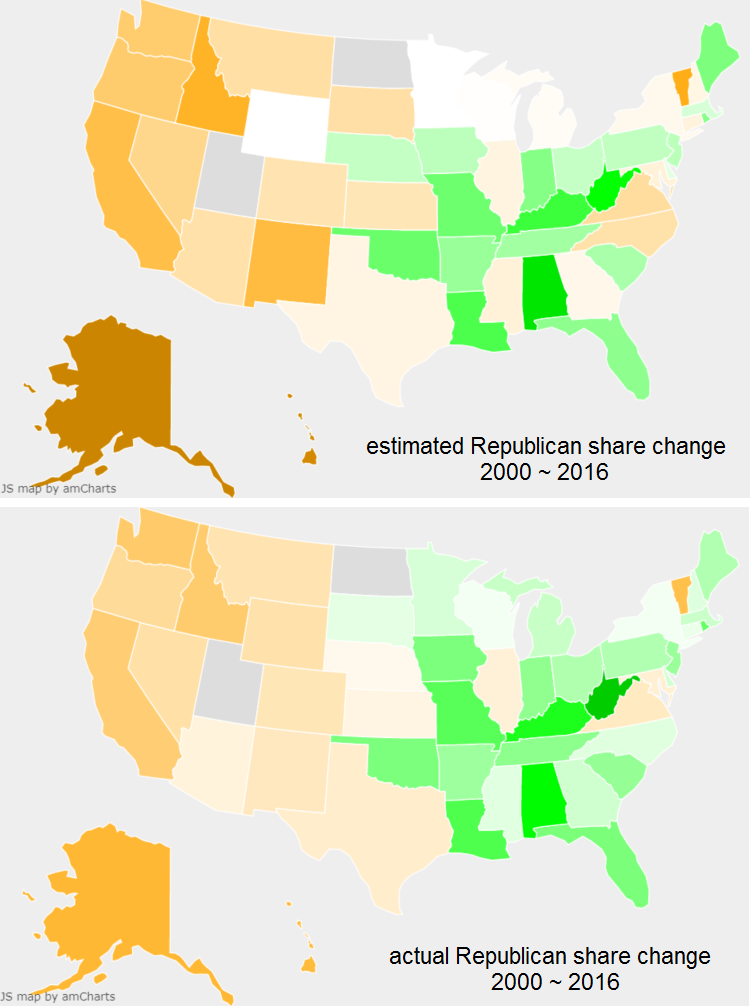
Likewise little changed for Trump as compared with Bush 2000 except that the general registration gap helped him to do better overall. Trump actually lost Nebraska to Bush, one of the states with the highest elevated registration rates after the correction; but he flipped South Dakota, Minnesota, Wisconsin, Mississippi, Michigan, Georgia, North Carolina, New York, Connecticut, and New Hampshire. While Clinton’s share range as compared to Gore tightened and dropped, Trump’s expanded and rose as compared with Bush. We might say that Clinton was less broadly appealing than Gore while Trump was more polarizing than Bush.
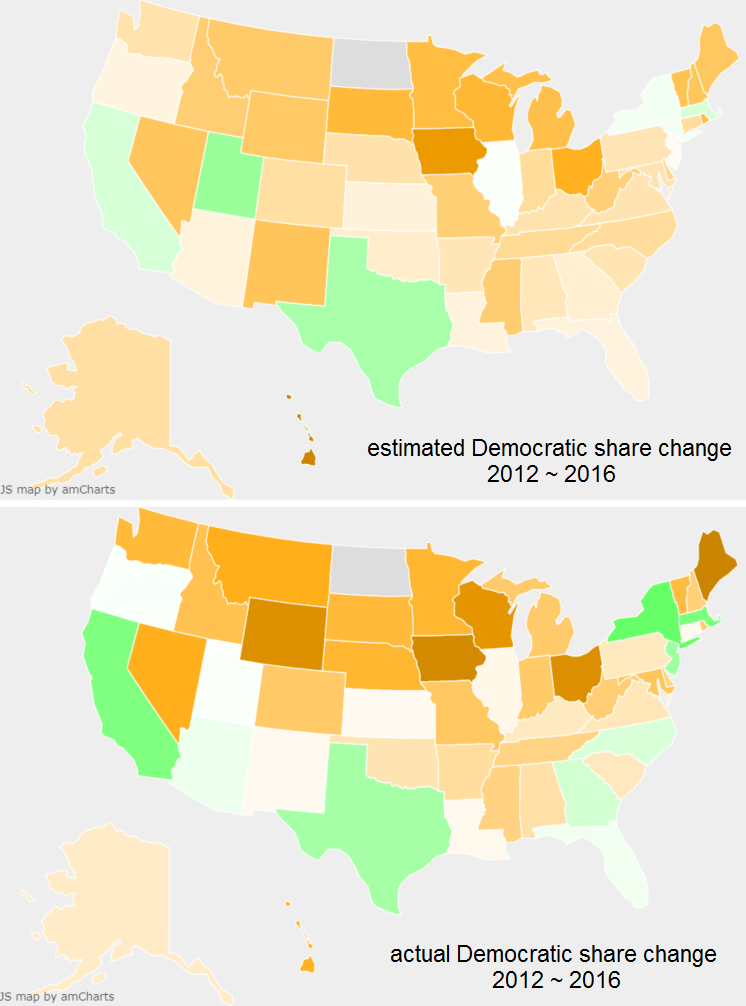
The comparison between Clinton and Obama 2012 is fairly affected though. The massive shift in North Dakota amplified her losses there — making it her single biggest loss rather than Hawaii as estimated — but even aside that there were some notable changes. Clinton flipped Oregon, Arizona, Florida, Georgia, North Carolina, and New Jersey from Obama when before they were estimated losses. So eleven states in all, not only six, gave her more share than Obama 2012. She also nearly tied in New Mexico and Kansas. Meanwhile she only flipped to lose Utah and, slightly and unsurprisingly, Illinois. The most interesting result is that the correction broadly helped Clinton but exposed a few states — especially when ignoring Trump’s rout in North Dakota — where she did much worse than others: Wyoming, Maine, Iowa, Wisconsin, and Ohio. Those last three states are again among the six that lost Democrats the White House in 2016. Retaining all three wouldn’t have won Clinton the election, but that plus flipping any other state (even the smallest by electoral vote count) would have.
Democratic coalition collapse in 2016
Finally let’s revisit the share shifts in those six lost states. There are a few interesting shifts from what was estimated:
- Share was higher than estimated for every state in every column (since registration was below the estimate in each).
- Democratic share in Florida was actually slightly up rather than more than 1% down as estimated.
- Overall turnout share was up, not down, in both Iowa and Michigan.
| State | Dem. | Rep. | Third Party | Total | Margin |
| Florida | 0.35% | 2.34% | 2.29% | 4.98% | 1.18% |
| Iowa | -7.69% | 6.47% | 5.49% | 4.27% | 8.89% |
| Mich. | -3.88% | 4.31% | 3.71% | 4.14% | 0.2% |
| Ohio | -7.47% | 2.56% | 2.75% | -2.16% | 7.29% |
| Penn. | -1.65% | 3.55% | 2.12% | 4.02% | 0.64% |
| Wis. | -7.25% | -0.14% | 4.48% | -3.01% | 0.68% |
Ultimately, there’s no way to look at this data which isn’t depressing. Turnout share was higher than estimated in most states, but that was because of broadly depressed registration. Revised numbers helped both candidates but helped Trump more. That strongly suggests that enthusiasm was down across the country but more sharply down for Democrats. Some of them ran to third parties, and some of them just didn’t register. Trump won from a critical mass of apathy, expressed in depressed registration and anemic major party turnout.
But in broad terms, Trump did more or less as well as both losing Republicans before him, gaining here but losing there, except notably in the midwest. Clinton lost share in every state to Obama 2008 except Arizona (in which she outperformed by less than 1%). She lost share in virtually every state to Obama 2012 [6]. Once again we see that Trump didn’t so much win the 2016 election as Clinton lost it. This is still true even after adjusting for widespread registration shortfalls below historical trends in more than three quarters of the states. Focusing on Clinton’s nationwide 3 million ballot margin over Trump dangerously distracts attention from the reality of significant disengagement in 2016, especially among Democrats.
Footnotes
[1] The alternative was to divide into the number of eligible voters. Estimating that number is much more challenging for several reasons, and I defended my decision to go with registration rates here. The US Elections Project has some interesting reading and data about its own approach here.
[2] As a general note: where significant, I mention the Census Bureau’s estimation of overall population growth since the last official census in 2010 as recorded here. Unless called out for a given state, I judged the overall growth curve not likely to meaningfully explain deviations from trends.
[3] It’s fair to note that it wasn’t just Evan McMullin who pulled third party votes. According to ballotpedia, McMullin won 21.5% of the overall vote in Utah to Libertarian Gary Johnson’s 3.5%.
[4] Another possibility is a “millennial” baby boom has led to a disproportionately large pool of nonvoting children. That’s a difficult argument to make for several reasons, but census estimates put that entire group (those born since 1998) at only 65 million. That’s an average of 3.6 million born per year, which is quite lower than the 2 million and change added each year in this decade, implying the average age of the nation actually tends older.
[5] Of course it is impossible to know who didn’t register, why, and for whom they might have voted if they had. This New York Times article adds to the confusion; it suggests that new registration primarily adds to Democratic ranks but that Republicans actually have a registration advantage because of defectors and “Democrats in name only.” But of the seven states with registration shortfalls larger than Trump’s margin, five voted for Trump and four defected from Obama 2012. It seems safe to conclude the shortfall primarily hurt the Democrats in those states. See here the full results for each state of the shortfall of registration from the estimation, as well as that shortfall juxtaposed with Trump’s winning margin in absolute votes.
[6] Clinton only gained 3% or more share over Obama 2012 in three states (and all were already solid locks): California, Massachusetts, and New York. She also slightly improved over him in places like Texas and North Carolina, which would have been captivating flips if the Democrats could have secured them. She even slightly edged out Obama 2012 in Florida, but still lost it to Trump; he outperformed Romney 2012 there by only about the same share margin that Clinton outperformed Obama 2012 in Texas (about 2.3%).