
Earlier this month I published a deep dive into the evolution of presidential elections in the 21st elections. The primary motivation for that, aside from better understanding the shocking result of Trump’s victory over Clinton, was to analyze the widely made observation that Clinton won the popular vote by a particularly large number of votes. Around the time of that publication, updated vote tallies from a few large states (California, New York, and to a much smaller extent Pennsylvania) allowed for another shocking headline: Clinton won more votes than Obama did in 2012.
That headline (correct though it was by 90,000 votes, or 0.15% more than Obama’s 2012 haul) served to further distract from the thesis of my piece, which was that Clinton’s campaign resulted in a significant relative dip in Democratic turnout across virtually all states. But amid the drumbeat of considering absolute vote totals across elections, one criticism of my approach was to question the utility of performing a relative analysis at all. And if it was going to be made, why choose overall voter registration to factor significantly into that analysis? This post more thoroughly considers the motivations for and alternatives to these choices to better explain why these methods probably best help us to measure differences between presidential elections.
Why compare turnout?
First, let’s be very clear about the impetus for the analysis. My perception of the reporting (and the reaction of my friends and acquaintances to it) that Clinton won many more votes than Trump (and later that she won more even than Obama in 2012) was with a connotation that Clinton was robbed of a profoundly decisive popular victory through the arcane, undemocratic, and even inherently racist institution of the Electoral College. Further, the reason for this robbery was a groundswell of racist, sexist, xenophobic, fascist, anti-progressive, and otherwise deplorable support for Trump that was heretofore unprecedented in modern American politics; or else it was due to a targeted left-leaning-voter suppression operation in key “red states”; or else it was to be blamed squarely on self-centered third party voters. This line of argument struck me not only as too convenient for its proponents but also likely to be demonstrably false by the available evidence, so I set out to better understand that evidence.
The first question — concerning the magnitude of this election robbery — was exactly how decisive was that nationwide 2.5 million vote lead (now 2.8 million [1])? The second question — concerning the 2016-unique explanations for the Electoral College disagreement — was actually many multifaceted questions which called for a relative comparison of previous elections across multiple dimensions. It became apparent that some method for understanding raw vote numbers across elections was needed.
Simple comparisons and their drawbacks
The easiest way to see that raw vote totals cannot be reliably compared across years is to recall that there are more people alive today to vote than have ever been. It would be absurd, for example, to try to understand Clinton’s loss by comparing her raw vote total to that of Franklin Roosevelt; though in 1944 he too beat his competitor, Thomas Dewey, by about 2.5 million votes. It wouldn’t make much more sense to compare Hillary Clinton’s vote tallies in 2016 to Bill Clinton’s vote tallies in 1992 to understand why the former lost while the latter won, even though both secured a plurality of votes in their respective races [2]. Forget nearly 3 million votes; Hillary Clinton won 20 million more votes this year than Bill Clinton did in 1992! But Bill Clinton won about 6 million votes more than his nearest competitor that year, incumbent George H.W. Bush. In the 21st century, even millions of votes might not make for proportionally significant national differences, and demographic changes could prevent meaningful raw total comparisons even between consecutive elections.
A common way to more meaningfully understand the results of an election is to consider the percentage of all votes cast that were won by each candidate or party [3]. That approach has two major drawbacks though in a country where not every eligible voter casts a ballot. First, considering only the percentage of votes cast artificially amplifies the perceived popularity of running candidates by ignoring the portion of the population that didn’t vote at all. Absent a compelling third party candidate or a sharp division in the vision of the major party candidates, a larger-than-usual portion of the electorate is lost to apathy. There’s no way to notice that by the measure of percent of votes cast alone, and that distortion will exist even in considering a single election in isolation. Second, it is impossible to compare the relative performance of a party to itself between elections. Consider two elections in which both major parties won the same percentage of all votes cast in each election; but in the first election, the entire population voted, while in the second, half the population didn’t bother to. Both parties did as well against each other in both elections, but surely neither party did as fine a job of engaging the electorate the second time as they did the first: both parties had (and lost) the opportunity to win voters that the other party hadn’t.
Turnout normalization techniques
From this it’s clear that there needs to be some means to correct, or normalize, for turnout across and even within elections [4]. But what is the best population of “would-be” voters to consider for the normalization? The number obtained by the decennial census isn’t a good choice since not every counted resident is eligible to vote (primarily since minors are counted but ineligible, but also because of the federal prohibition on voting for non-citizens and felons). Through its Voter and Registration Survey conducted in even-numbered years, the Census Bureau maintains two interesting per-state estimates for each federal election (including midterms) going back to 1978: the total number of citizens (a slight overestimate of the number of people eligible to vote), and the total number of people reporting to be registered. I believe that either measure could provide for a relevant and interesting normalization — and that reasonable people can disagree about which is better — but I prefer the number of registered voters for several reasons.
Registration requires effort that demonstrates some minimal engagement with the state, even in states which provide automatic registration along with other state licensing. That fact alone suggests that registration could be better proxy than citizenship (itself a proxy for eligibility) to measure relative voter engagement with particular campaigns across elections. Unregistered citizens may be basically ignorant of or indifferent to their rights in the electoral process federally or in their state, and they’re likely to stay unregistered across many elections. Significantly, a registered voter who doesn’t vote in a particular election — or perhaps merely doesn’t vote for president but does vote on state or local candidates and measures — can be better understood to have weighed in on that election than an otherwise eligible voter who has never registered. Particularly controversial elections could lead to sudden swells in the ranks of registered voters, but then the turnout is still a proportion of that underlying registration rate [5].
Eligibility vs. Registration: an appeal to survey data
The Census Bureau’s actual 21st century data doesn’t present a compelling argument for choosing one over the other until we also consider midterm elections.
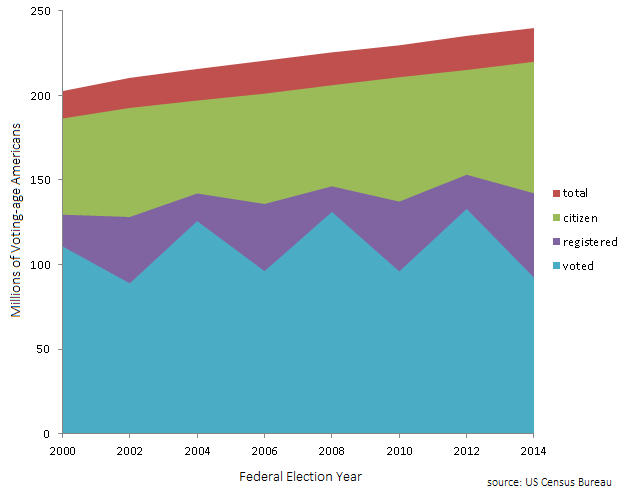
The main surprise for me here is that the well-known dip in turnout during midterm elections has a corresponding but smaller dip in registration rate too. Roughly speaking, I believe that those registration rate dips can be explained through attrition (through moves and deaths) not replaced by new or re-registration (due to apathy about midterms) until the next presidential election year [6]. Consider the turnout of each category: citizenship, the ratio of citizens to the voting-age public (which has remained strikingly consistent over time); registration, the ratio of registered voters to citizens; registered voting, the percent of registered voters who voted; and citizen voting, the percent of citizens who voted:
| Year | Citizenship | Registration | Registered Voting | Citizen Voting |
| 2000 | 91.98% | 69.51% | 85.55% | 59.47% |
| 2002 | 91.56% | 66.52% | 69.37% | 46.15% |
| 2004 | 91.34% | 72.11% | 88.5% | 63.82% |
| 2006 | 91.15% | 67.56% | 70.76% | 47.8% |
| 2008 | 91.38% | 71.0% | 89.63% | 63.64% |
| 2010 | 91.78% | 65.12% | 69.93% | 45.53% |
| 2012 | 91.43% | 71.21% | 86.81% | 61.81% |
| 2014 | 91.69% | 64.64% | 64.89% | 41.94% |
2000 was an outlier, with both the highest citizenship and lowest registration of any 21st century presidential election. Comparing it with 2012 for example, when the registration rate was nearly 2% higher but the citizenship rate more than 0.5% lower, registered turnout was up by about 1.3% while overall citizen turnout was up 2.3%. Another interesting comparison is 2004 to 2008: the citizenship rate was basically unchanged but registration went down 1.1%; that led to a 1.1% rise in registered turnout while overall citizen turnout went slightly down. The measures don’t disagree too much, in part because registration volatility is only a few times more pronounced than citizenship volatility. But it seems that in general, considering turnout among citizens is a more erratic measure than considering turnout among registered voters. Some of the volatility of the election results is masked by fluctuations in the registration rate, which is itself somewhat more volatile than the relatively stable citizenship rate. I admit this analysis forms a decent argument for the primacy of the eligibility normalization.
But I think the periodic consistency across midterms in the registration rate, as well as the drop in absolute turnout, is telling. Compare, for example, the 2006 and 2010 midterms. Over that period (and including 2008) the citizenship rate uniformly increased, the only such four-year stretch in the 21st century; but except for the bump to the registration rate in 2008 (which was still lower than 2004’s), the registration rate fell. As a result, the depressed turnout of the 2010 midterm registered as less than a 1% drop from 2006 when normalized against registered voters but was more than 2% down when normalized against the overall citizen population. Which measure more accurately describes the change in turnout between these congressional elections? Did the White House party change in 2008 have an effect on 2010 registration or turnout (or both)? And how should we interpret 2008’s relatively modest registration correction when trying to compare 2006 to 2010?
Now compare 2010 to 2014, the least compelling election this century by any of these measures. Citizenship fell by only 0.1% with registration down 0.5%, a sharply smaller drop than between 2006 and 2010. Under these conditions, registered turnout still fell about 5% but overall citizen turnout was down somewhat less than 4%. Both measures clearly register a profound drop in voter engagement, but the usually more volatile measure (citizen turnout) underreported it by comparison.
Taking all this together, I see decent evidence that normalizing across citizens is a less consistent technique than normalizing across registered voters. Probably due to the larger denominator in the ratio, citizen normalization will tend to mask large swings across elections (like between 2010 and 2014) and might also smooth out subtler changes (like between 2004 and 2008, when the sign of the turnout change was actually different between the measures but the citizen normalization was closer to statistical noise). For presidential elections, when both registration and turnout are higher in absolute numbers, these differences are much less pronounced and might even be safely ignored; but the extremes of midyear slumps suggest to me that registration normalization should be preferred.
Conclusions
We’ve seen that comparing raw vote counts between elections is a fundamentally misleading approach since it ignores demographic shifts which could be significant even in consecutive presidential elections. At a minimum, partisan comparisons between two elections (and even within a single election) should be normalized to provide context-sensitive comparisons. But normalizing by considering only percentages of votes cast can easily hide significant swings in relative partisan turnout, as in 2016 when Hillary Clinton won 0.15% more votes than Barack Obama in 2012 but was, according to my own analysis, voted for by around 2% fewer of the eligible voters.
Between two other competing techniques for normalizing votes cast, comparing them to the number of voting-age citizens and comparing them to the number of registered voters, there are several arguments in favour of the latter: we should be able to infer more about the electorate’s intent by considering the engagement of those who choose to register; the periodic pattern of registration rates gives us more insight about patterns of engagement than simple citizenship rates, which are merely reflections of birth rates; and the data suggest the registration rate leads to a more subtle normalization that better models turnout trends.
Footnotes
[1] True as of December 15th according to the continually updated vote tracker maintained by David Wasserman of cookpolitical.com.
[2] An operative word there is plurality: in both 1992 and 2016, third party candidates were sufficiently compelling that no candidate won an outright majority of votes cast.
[3] The ease of that calculation alone renders the consideration of raw vote totals in the modern age — even within individual states — a highly questionable and arguably cynical move. What better way to placate a grieving partisan than to dazzle him with the notion that his party actually “won” by millions of votes? What better way to agitate for a fundamental change of election machinery that might benefit that party?
[4] Especially for understanding the intention and mood of the electorate, normalizing for turnout has the upshot of considering the decision not to vote as a kind of a vote itself.
[5] It could be interesting to monitor the ratio of registration to eligibility, but spikes there could signal a controversial election as much as distract from a sea change in cross-generation engagement due to an uneven distribution in birth rates. For example, it’s possible that Millennials are generally more politically engaged than their parents, but then a swell in the percent of eligible adults who are registered could be explained by the timing of their birth as much or more than the relative strength of the campaigns in the first election in which they participate.
[6] Using the 2010 Census as a convenient data point, there were about 308 million Americans counted, but only 230 million of them were voting-age adults (including non-citizens). That implies there were about 78 million minors in 2010, so assuming a roughly uniform distribution of them, there are around 8.5 million newly eligible voting-age adults every two years. But in 2012, the Census Bureau reported only 4.5 million more citizens than in 2010, very likely because around 4 million citizens died during those two years (a number roughly corroborated by the Center for Disease Control). The Census Bureau reported about 9 million fewer registered voters in 2010 than in 2008, so deaths don’t account for all of them; but that number is decently explained if about as many people moved and didn’t re-register for midterm elections as died. (Really, that number of such people must be somewhat larger since it’s also correcting for the sort of people who register on their 18th birthdays regardless of what year it is.)
On the other hand, the Census Bureau reported close to 16 million more registered voters in 2012 than in 2010. Take the around 17 million newly eligible 18- to 23-year-olds, subtract the 8 or so million citizen deaths since 2008, then add back in those (at least) 5 million who moved and didn’t re-register for 2010 midterms, and you have at least 14 million people. The remaining deficit in this very round number can be plausibly explained by immigrants who naturalized since 2010 and the smattering of long-eligible citizens who never voted in the past but decided 2012 would finally be the first election they participate in.